46 KiB
CSE320 Fall 2018 - Debugging Reference Document
In this document you will learn about gdb, the preprocessor, assert statements, valgrind, and a linter to debug your assignments in C.
Table of Contents
GDB
The tool gdb is a command line debugger for C. It helps you detect errors which may only occur during the execution time of your program. Let us start out with a simple program so you can learn how to set breakpoints, step through your program, and inspect the values of variables in it.
// debug.c
#include <stdio.h>
#include <stdlib.h>

int main(int argc, char *argv[]) {
    int i = 0; char *string = "Hello, World!";
    printf("%s\n", string);
    return EXIT_SUCCESS;
}
Compile the program as usual:
$ gcc debug.c
$ ls
a.out debug.c
$
Now run it with the gdb program.
$ gdb a.out
...
Reading symbols from a.out...( no debugging symbols found )...done.
(gdb)
:nerd: Notice the warning: no debugging symbols found. This means that the executable file does not contain the extra information needed to debug the code from the perspective of the C source file. You can only view the assembly language of the target architecture when you see this.
:nerd: In the above printout, the ellipses ... indicate that there is other text in its place. There is quite a bit of text that prints out when you first start
gdb. This mainly describes legal information and information about the current version of the debugger installed. To help shorten the length of this document we have replaced this text with ... in the example printouts.
If you were an x86_84 assembly expert this might be ok for you but most of us are not. The compiler offers the -g flag which will add symbols to the executable file created. We can use symbols from the source code to set our breakpoints. It also allows us to see the source code as we step through the file. Recompile the code with the -g flag to add these symbols.
$ gcc -g debug.c
$ ls
a.out debug.c
$
Now when you run gdb it should locate the debugging symbols.
 $ gdb a.out
…
Reading symbols from a.out...done.
(gdb)
:nerd: The string
(gdb)marks the prompt that is used to interact with the debugger. Any commands you type to instructgdbon what to do should be typed at prompts that look like this.
Setting breakpoints
Now that the file has debugging symbols in it, you can set breakpoints either using the name of a function or the line number. To set a break point in the gdb console you should type break LINE_NUMBER, where LINE_NUMBER is the line number that you want to set a breakpoint on. Alternatively, if you wanted gdb to start at the beginning of a function you can type break FUNCTION_NAME, where FUNCTION_NAME is the name of the function you want to debug. Let us use our sample program debug.c and start debugging from the main function.
(gdb) break main
Breakpoint 1 at 0x40053c: file debug.c, line 6.
(gdb)
or
(gdb) break 6
Breakpoint 1 at 0x40053c: file debug.c, line 6.
(gdb)
:nerd: Both ways above set the breakpoint at the first line in
main.
When dealing with multiple files you may want to set a break point in another file you would do so with the gdb command:
(gdb) break file.c:8
The format is FILENAME:LINE_NUMBER.
Once you have set all the breakpoints in your program, you use the command run to start the program. The program will execute until it reaches the first breakpoint set in the program.
(gdb) break main
Breakpoint 1 at 0x40053c: file debug.c, line 6.
(gdb) run
Starting program: /home/cse320/a.out
Breakpoint 1, main (argc=1, argv=0x7fffffffdfd8) at debug.c:6
6 int i = 0; char *string = "Hello, World!";
(gdb)
In the above output, you should be able to tell that you hit Breakpoint 1 which is the main function. It has the arguments argc which is equal to the value 1 and argv which starts at the address 0x7fffffffdfd8. The statement debug.c:6 tells you that the breakpoint occurred in the file debug.c on line 6. The next line shows you the source code for line 6 which is the line where the breakpoint is set.
Printing contents of variables
GDB provides you with some helpful commands to inspect variables in your program. The easiest and probably most useful command is the print command. The print command will show the contents of a variable at the current moment in your program. It also accepts various formatting options to format the output in different ways. Let us print out the value of i and string at the current moment.
6 int i = 0; char *string = "Hello, World!";
(gdb) print i
$1 = 32767
(gdb) print string
$2 = 0x0
Notice that even though the source code shows that i = 0 and *string = "Hello, World!", the debugger is showing us that it currently is not. This happens because the current line has not actually executed yet so these assignments have not been made. The variables are set to these junk values because even though the code has not yet assigned values to these variables, the stack frame has already been created, and in the case of our x86 machines local variables are stored onto the stack.
:nerd: If you're interested in learning more about the stack frame used in x86_64 *nix environments, there are two great articles you can read.
Navigating to the next line
Now that you have inspected all that is interesting at this line, its time to move to the next line in the program. To do that you can either type next or n into the gdb prompt.
(gdb) next
7 printf("%s\n", string);
(gdb)
If you print out the values of i and string again they should be as described in the source code.
7 printf("%s\n", string);
(gdb) print i
$3 = 0
(gdb) print string
$4 = 0x4005e4 "Hello, World!"
(gdb)
Changing values at runtime
There is another command called set, which allows you to change the value of a variable while the program is running. This can be useful if you want to force a certain condition to occur. Let's change the value of string while the program is running so when line 7 executes it will no longer print out Hello, World!.
(gdb) set var string = "Debugging is fun"
$5 = 0x602010 "Debugging is fun"
(gdb)
Now, when line 7 executes this program will print Debugging is fun instead of Hello, World!
Continuing the program
At some point, you might get tired of typing next or n to reach your next breakpoint, or maybe you just want the program to run until the end. To do that, you use the command continue or c to make the program run to next breakpoint or completion.
(gdb) continue
Continuing.
Debugging is fun
[Inferior 1 (process 4943) exited normally]
(gdb)
:nerd: Notice that the program printed out
Debugging is funinstead ofHello, World!.
Restarting the program
If you wish to restart the program from the start again, with the same breakpoints you just issue the run command again to do so.
Debugging is fun
[Inferior 1 (process 4943) exited normally]
(gdb) run
Starting program: /home/cse320/a.out

Breakpoint 1, main (argc=1, argv=0x7fffffffdfd8) at debug.c:6
6 int i = 0; char *string = "Hello, World!";
(gdb)
Inspecting types
There might be times when you forget the type of a variable while debugging. Luckily for us gdb has the command ptype which will print out the type of a variable.
(gdb) ptype i
type = int
(gdb) ptype string
type = char *
(gdb) ptype &i
type = int *
(gdb)
Inspecting arrays
You can use the print command to inspect the values of arrays as well. Let's test this out by viewing the contents of the argv array passed to the main function.
(gdb) print argv
$7 = (char **) 0x7fffffffdfd8
(gdb) print argv[0]
$8 = 0x7fffffffe318 "/home/cse320/a.out"
(gdb) pytpe argv[0]
type = char *
(gdb) print argv[1]
$9 = 0x0
:nerd: Every program has at least 1 command line argument passed to it. This argument is usually the path to the executable although it doesn’t have to be. IE: execve can change it.
What happens if you try to print past argv[1]? On my system, it started printing out what seemed to be environment variables.
(gdb) print argv[2]
$10 = 0x7fffffffe33a "XDG_VTNR=7"
(gdb) print argv[3]
$11 = 0x7fffffffe345 "ORBIT_SOCKETDIR=/tmp/orbit-cse320"
(gdb) print argv[11]
$12 = 0x7fffffffe434 "TERM=xterm"
This is in the realm of undefined behavior, but this happens because main actually has multiple prototypes (shown below). In this gdb session, the memory for these storage containers must be located right after *argv[] in memory. So when we started printing past the end of argv we actually started printing the values of the next contents in memory.
// some main prototypes
void main(void);
void main();
int main(void);
int main();
int main(int argc, char *argv[]);
int main(int argc, char **argv);
int main(int argc, char **argv, char **envp);
int main(int argc, char **argv, char **envp, char **apple);
The values that printed out most likely coincided with the contents of char **envp. You should try this out on different operating systems and see if anything different happens.
Exiting gdb
To end your current session in gdb, type the command quit to exit.
(gdb) quit
$
Debugging slightly larger programs
The program debug.c allowed us to showcase some of the basic things you can do with gdb, but it doesn't really let us show off all the capabilities of gdb. To help do that, we introduce the program debug2.c which adds slightly more complexity.
// debug2.c
1  #include <stdio.h>
2  #include <stdlib.h>
3
4  int factorial(int num);
5
6  int main(int argc, char *argv[]) {
7      int value, result;
8	   printf("Enter a positive number to compute the factorial of: ");
9	   scanf("%d", &value);
10	   // You should error check this...
11	   result = factorial(value);
12	   printf("The result of %d! is %d\n", value, result);
13	   return EXIT_SUCCESS;
14 }
15
16 int factorial(int num) {
17	   if(num <= 1) {
18		   return 1;
19	   } else {
20	       return num * factorial(num - 1);
21     }
22 }
Let us set a breakpoint on line 11 and start the program. When the program prompts you, enter the value 5 and press enter.
gcc -Wall -Werror -g debug2.c
$ gdb a.out
...
Reading symbols from a.out...done.
(gdb) break 11
Breakpoint 1 at 0x400659: file debug2.c, line 11.
(gdb) run
Starting program: /home/cse320/a.out
Please enter a positive number to compute the factorial of: 5

Breakpoint 1, main (argc=1, argv=0x7fffffffdd08) at debug2.c:11
11		result = factorial(value);
We are currently stopped at line 11 before calling the factorial function. If we want to advance into the factorial function how do we do that? If we try to use the command next we will get undesirable results.
(gdb) next
12		printf("The result of %d! is %d\n", value, result);
(gdb)
The program already executed factorial and you are now at the statement inside main on line 12. Instead you should use the command step or s so that you can step inside of the function factorial.
Breakpoint 1, main (argc=1, argv=0x7fffffffdd08) at debug2.c:11
11		result = factorial(value);
(gdb) step
factorial (num=5) at debug2.c:17
17		if(num <= 1) {
(gdb)
Inspecting arguments and locals
While its possible to use the command print to inspect the arguments and local variables of a function, gdb also has the command info to expedite this process. The info command takes its own set of options. One such option is args which shows the name and value of all arguments passed into the function.
(gdb) info args
num = 5
(gdb)
:nerd: Yes this function only has one argument so the
infocommand in this case is no faster or better then just typingprint num. But if you had a function which contained many arguments this command may be helpful.
If your function had local variables you could instead provide the option locals to the info command. In this case though there are no local variables declared in this function so it tells us there are none.
(gdb) info locals
No locals.
(gdb)
Viewing stack frames
The debugger also gives us the ability to view how many stack frames down we currently are. To do that you type the command backtrace.
(gdb) backtrace
#0  factorial (num=5) at debug2.c:17
#1  0x0000000000400663 in main (argc=1, argv=0x7fffffffdd08) at debug2.c:11
Currently, you can see that, at this point in the programs execution, there are two stack frames created. Another awesome feature involving stack frames and gdb is that you can switch to a different stack frame and inspect the variables in that frame by using the frame command.
(gdb) frame 1
#1  0x0000000000400663 in main (argc=1, argv=0x7fffffffdd08) at debug2.c:11
11		result = factorial(value);
(gdb) info locals
value = 5
result = 32767
:nerd: Here we were able to use the
info localscommand to see the current value of all the local variables in the frame 1 (which is themainfunction). Do you know why the variableresultis currently set to a seemingly arbitrary number?
Now let's switch back to frame 0 and set a breakpoint at line 17 and use the continue command.
(gdb) backtrace
#0  factorial (num=5) at debug2.c:17
#1  0x0000000000400663 in main (argc=1, argv=0x7fffffffdd08) at debug2.c:11
(gdb) frame 0
#0  factorial (num=5) at debug2.c:17
17		if(num <= 1) {
(gdb) break 17
Breakpoint 2 at 0x4006a3: file debug2.c, line 17.
(gdb) continue
Continuing.

Breakpoint 2, factorial (num=4) at debug2.c:17
17		if(num <= 1) {
(gdb)
If you use the backtrace command again, you should now see that your program has created 3 stack frames.
(gdb) backtrace
#0  factorial (num=4) at debug2.c:17
#1  0x00000000004006bd in factorial (num=5) at debug2.c:20
#2  0x0000000000400663 in main (argc=1, argv=0x7fffffffdd08) at debug2.c:11
(gdb)
If you're really dying to see more information, there's an option you can provide to backtrace called full which prints out all the argument and local variable values for each frame that currently exists.
(gdb) backtrace full
#0  factorial (num=4) at debug2.c:17
No locals.
#1  0x00000000004006bd in factorial (num=5) at debug2.c:20
No locals.
#2  0x0000000000400663 in main (argc=1, argv=0x7fffffffdd08) at debug2.c:11
        value = 5
        result = 32767
(gdb)
To get the most information about the current frame you are in, you can also use the command info frame to see lots of information about the current frame.
(gdb) info frame
Stack level 0, frame at 0x7fffffffdbe0:
 rip = 0x4006a3 in factorial (debug2.c:17); saved rip = 0x4006bd
 called by frame at 0x7fffffffdc00
 source language c.
 Arglist at 0x7fffffffdbd0, args: num=4
 Locals at 0x7fffffffdbd0, Previous frame's sp is 0x7fffffffdbe0
 Saved registers:
  rbp at 0x7fffffffdbd0, rip at 0x7fffffffdbd8
:nerd: You should notice that the register names here may not be familiar to you. This is because the this command
info framewas executed on a machine running the x86-64 architecture which has a different set of registers with different names than MIPS. If you were to execute the same command on Sparky it would also look different because Sparky runs on a SPARC architecture.
Removing breakpoints
Now that we have played around with backtrace and changing frames, let's remove the breakpoint and get back to main so we can see the result of factorial. To remove breakpoints, gdb has the clear command. Typing clear by itself removes all breakpoints, but we only want to remove the one currently in factorial. If we use the command clear and then the name of the function it will clear the breakpoint inside of that function.
(gdb) break 12
Breakpoint 3 at 0x400666: file debug2.c, line 12.
(gdb) clear factorial
Deleted breakpoint 2
(gdb) continue
Continuing.

Breakpoint 3, main (argc=1, argv=0x7fffffffdd08) at debug2.c:12
12		printf("The result of %d! is %d\n", value, result);
(gdb)
Finishing up debugging
The result of 5! should be 120. We can first check this by using the print command to inspect the value of result.
(gdb) print result
$1 = 120
(gdb)
Using the continue command one last time the program should run to completion and we can then quit by typing quit.
(gdb) continue
Continuing.
The result of 5! is 120
[Inferior 1 (process 28948) exited normally]
(gdb) quit
$
More gdb resources
The gdb debugger is a very powerful tool and many books and tutorials have been created to help show all of its power. If you are interested in learning even more things that can be done with gdb, we refer you to the following online resources.
- official docs
- useful commands
- learning C with gdb
- gdb interactive shell
- debugging with gdb
- quick guide to gdb
- gdb debugger tutorial
Slightly better gdb tool
Occasionally, its nice to be able to see the source code while debugging your programs in C. You can either provide a flag to make gdb display the source code or use the program cgdb which is slightly nicer.
cgdb
The program cgdb will split your terminal into two windows. One showing your source code and the other showing the gdb input window.
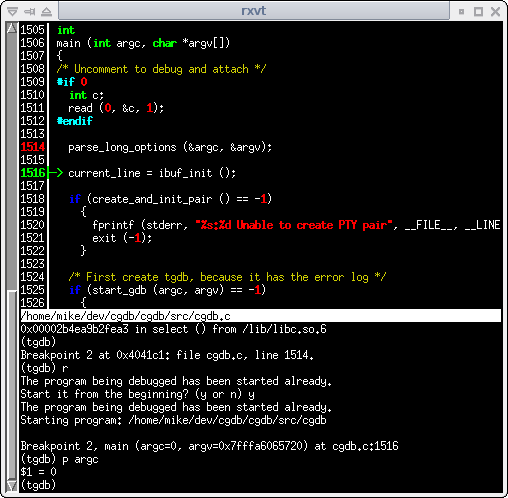
It is possible to switch between the panes by pressing esc to switch to the code pane. In the code pane you can press the up and down arrow keys to look at the code. When you get to a line where you would want to set a breakpoint you can press the spacebar to toggle a break point on and off.
When your done looking at the code you can press i to go back to the gdb input window. All the commands in cgdb are exactly the same as gdb.
More commands can be found here.
gdb -tui
The tool gdb itself also has a graphical mode which you can start by using the flag -tui.
$ gdb -tui a.out

Reference here for commands to control the panes.
Visual debugger limitations
Unfortunately, both these tools when in the "gui" mode suffer from the same issue. If you want to debug a program that accepts input from the command line, they do weird things and often get stuck and freeze. To see your source code (or at least part of it) you can type l and it will display some of the source code currently around where your program is currently stopped at.
Breakpoint 1, main (argc=1, argv=0x7fffffffdd08) at debug2.c:6
6	int main(int argc, char *argv[]) {
(gdb) l
1	#include <stdio.h>
2	#include <stdlib.h>
3
4	int factorial(int num);
5
6	int main(int argc, char *argv[]) {
7		int value, result;
8		printf("Enter a positive number to compute the factorial of: ");
9		scanf("%d", &value);
10		// You should error check this...
(gdb)
Its also possible for you to redirect input from a file into your gdb session. To do this you first need to create a text file that has the commands you want to type. The program debug2.c expects the user to type a positive number at line 9. If we wanted to use cgdb or gdb -tui, we could make the text file input.txt that has the following contents:
5
Now start a new gdb debugging session and when you type run you can redirect the the file using the < operator.
gcc -Wall -Werror -g debug2.c
$ gdb -tui a.out
...
Reading symbols from a.out...done.
(gdb) break 11
Breakpoint 1 at 0x400659: file debug2.c, line 11.
(gdb) run < input.txt
...
rr: lightweight recording & deterministic debugging
There's a tool currently being developed by Mozilla called rr. This tool is described as an enhancement to gdb. It allows us to record the execution of a program, and then you can replay this execution over and over. Mozilla provides a nice slideshow explaining the technology. A simple getting started tutorial can be found here as well.
This concludes our very short gdb introduction.
The preprocessor
So far, you have learned a bit about using gcc and gdb to help debug and fix your programs. While these are very useful tools, sometimes the easiest way to see what is happening in your program is to just use print statements. We shouldn't just put printf all over our program though. We might not always want to see these print outs (way too much information for normal operation). One possible solution to this is passing a command line argument that turns debugging on and off. This might be an acceptable solution but it will clutter our code with lots of if statements to check if debugging is enabled or not, make our binary larger when we don't want debugging enabled, etc. Instead, we will use some preprocessor tricks to give us some logging statements when we compile with the flag -DDEBUG. When we compile without the flag -DDEBUG, these debugging statements will not be added to the executable and therefore will not print.
Logging with the preprocessor
Somewhere at the top of your source file put the following line of code defining our debug logging macro
#define debug(msg) printf("DEBUG: %s", msg)
Then in your program use the debug macro
// debug.c
#include <stdlib.h>
#include <stdio.h>

#define debug(msg) printf("DEBUG: %s", msg)

int main(int argc, char *argv[]) {
	debug("Hello, World!\n");
	return EXIT_SUCCESS;
}
Then compile your program and run it.
$ gcc debug.c
$ ./a.out
DEBUG: Hello, World!
Great! You just created your first preprocessor macro. Unfortunately, this is no better than just adding a print statement. Let's fix that!
The preprocessor has if, elif, and else directives that that we can use to control what gets added during compilation. Let's create an if directive that will include a section of code if DEBUG is defined within the preprocessor.
//debug.c
#include <stdlib.h>
#include <stdio.h>

#define debug(msg) printf("DEBUG: %s", msg)

int main(int argc, char *argv[]) {
	#ifdef DEBUG
		debug("Debug flag was defined\n");
	#endif
	printf("Hello, World!\n");
	return EXIT_SUCCESS;
}
When we compile this program, it will check to see if #define DEBUG was defined in our program. Let's test this out.
$ gcc debug.c
$ ./a.out
Hello, World!
Cool! The debug message didn't print out. Now let's define DEBUG during the compilation process, and run the program again.
:nerd: The flag
-Dstands for define.
$ gcc -DDEBUG debug.c
$ ./a,out
DEBUG: Debug flag was defined
Hello, World!
Here you can see that debug was defined so that extra code between #ifdef DEBUG and #endif was included. This technique will work for certain situations, but if we have a lot of logging messages in our program this will quickly clutter our code and make it unreadable. Fortunately we can do better.
Instead of doing #ifdef DEBUG all over our program, we can instead do #ifdef DEBUG around our #define debug macro.
// debug.c
#include <stdlib.h>
#include <stdio.h>

#ifdef DEBUG
	#define debug(msg) printf("DEBUG: %s", msg)
#endif

int main(int argc, char *argv[]) {
	debug("Debug flag was defined\n");
	printf("Hello, World!\n");
	return EXIT_SUCCESS;
}
There is an issue with this, but let's try to compile the program.
$ gcc -DDEBUG debug.c
$ ./a.out
DEBUG: Debug flag was defined
Hello, World!
Cool it works. Now let's try to compile it without defining -DDEBUG.
$ gcc debug.c
/tmp/cc6F04VW.o: In function `main':
debug.c:(.text+0x1a): undefined reference to `debug'
collect2: error: ld returned 1 exit status
Whoops. What happened here? Well when we used -DDEBUG the debug macro was defined, so it worked as expected. When we don't compile with -DDEBUG the #define debug is never declared in our file so it is never substituted in our program. Since we used debug in the middle of our code, the preprocessor and compiler have no idea what debug symbol is, so it fails. Luckily this is easy to fix. We simply have to add another case to our preprocessor if, else statement to handle this case.
// debug.c
#include <stdlib.h>
#include <stdio.h>

#ifdef DEBUG
	#define debug(msg) printf("DEBUG: %s", msg)
#else
	#define debug(msg)
#endif

int main(int argc, char *argv[]) {
	debug("Debug flag was defined\n");
	printf("Hello, World!\n");
	return EXIT_SUCCESS;
}
Here we tell the preprocessor to replace any occurrences of debug(msg) with nothing. So now, when we don't compile with -DDEBUG, the preprocessor simply replaces debug("Debug flag was defined\n") with an empty space. Let's compile again.
$ gcc debug.c
$ ./a.out
Hello, World!
Cool. Now we can embed debug macros all over our program that look like normal functions. There are still a few more cool tricks we can do to make this better.
The preprocessor has a few special macros defined called __LINE__, __FILE__, and __FUNCTION__. These macros will be replaced by the preprocessor to evaluate to the line number where the macro is called, the filename that the macro is called in, and the function name that the macro is called in. Let's play with this a bit.
// debug.c
#include <stdlib.h>
#include <stdio.h>

#ifdef DEBUG
	#define debug(msg) printf("DEBUG: %s:%s:%d %s", __FILE__, __FUNCTION__, __LINE__, msg)
#else
	#define debug(msg)
#endif

int main(int argc, char *argv[]) {
	debug("Debug flag was defined\n");
	printf("Hello, World!\n");
	return EXIT_SUCCESS;
}
Let's compile this program and run.
gcc -DDEBUG debug.c
$ ./a.out
DEBUG: debug.c:main:11 Debug flag was defined
Hello, World!
As you can see all the __FILE__, __FUNCTION__, and __LINE__ were replaced with the corresponding values for when debug was called in the program. Pretty cool, but we can still do even better! Normally when we want to print something, we use printf(), the format specifiers and variable arguments to print useful information. With our current setup though we can't do that. Fortunately for us the preprocessor offers up a __VA_ARGS__ macro which we can use to accomplish this.
:nerd: I want to point out that the syntax for this gets a bit crazy and hard to understand (complex preprocessor stuff is a bit of a black art). I'll try my best to describe it but you may need to do some more googling if the below explanation is not sufficient.
// debug.c
#include <stdlib.h>
#include <stdio.h>

#ifdef DEBUG
	#define debug(fmt, ...) printf("DEBUG: %s:%s:%d " fmt, __FILE__, __FUNCTION__, __LINE__, ##__VA_ARGS__)
#else
	#define debug(fmt, ...)
#endif

int main(int argc, char *argv[]) {
	debug("Program has %d args\n", argc);
	printf("Hello, World!\n");
	return EXIT_SUCCESS;
}
First, let's compile and run the program and see the results.
$ gcc -DDEBUG debug.c
$ ./a.out
DEBUG: debug.c:main:11 Program has 1 args
Hello, World!
$ gcc debug.c
$ ./a.out
Hello, World!
The macro works as expected, but let's try to explain it a bit.
First, we changed the definition of the macro to be #define debug(fmt, ...). The first argument fmt is the format string that we normally define for printf and ... is the way to declare a macro that accepts a variable number of arguments.
Next we have "DEBUG: %s:%s:%d " fmt. This was very confusing to me at first, but the C compiler can concatenate string literals that are next to each other. So if fmt was the string "crazy %d concatenation" then this statements evaluates to "DEBUG: %s:%s:%d crazy %d concatenation". Then, we have our predefined preprocessor macros that are used for the string "DEBUG: %s:%s:%d ", and then we reach this next confusing statement: , ##__VA_ARGS__. The macro __VA_ARGS__ will expand into the variable arguments provided to the debug statement, but then we have this crazy , ##. This is a hack for allowing no arguments to be passed to the debug macro, Ex. debug("I have no varargs"). If we didn't do this, the previous debug statement would throw an warning/error during the compilation process as it would expect a __VA_ARGS__ value.
This is one of the many interesting things we can use the C preprocessor for. I'll leave you off with a final example of another interesting example that you might see in real code. Have fun and experiment!
// debug.c
#include <stdlib.h>
#include <stdio.h>

#ifdef DEBUG
	#define debug(fmt, ...) do{printf("DEBUG: %s:%s:%d " fmt, __FILE__, __FUNCTION__, __LINE__, ##__VA_ARGS__);}while(0)
	#define info(fmt, ...) do{printf("INFO: %s:%s:%d " fmt, __FILE__, __FUNCTION__, __LINE__, ##__VA_ARGS__);}while(0)
#else
	#define debug(fmt, ...)
	#define info(fmt, ...) do{printf("INFO: " fmt, ##__VA_ARGS__);}while(0)
#endif

int main(int argc, char *argv[]) {
	debug("Program has %d args\n", argc);
	printf("Hello, World!\n");
	info("Info statement. Should print out always, with varying amounts of information depending on flags provided.\n");
	return EXIT_SUCCESS;
}
$ gcc debug.c
$ ./a.out
Hello, World!
INFO: Info statement. Should print out always, with varying amounts of information depending on flags provided.
$ gcc -DEBUG debug.c
$ ./a.out
DEBUG: debug.c:main:13 Program has 1 args
Hello, World!
INFO: debug.c:main:15 Info statement. Should print out always, with varying amounts of information depending on flags provided.
:nerd: Some programmers like to wrap the code in macros with a
do{ /* some code here */ }while(false)loop. They do this because if your macro is made up of multiple statements, it will force you to add;to all the statements in the do while loop. Then, you still have to terminate this macro with a;when you use it, which makes it seem like a normal function in your C code.
tldr; It is a way to prevent yourself from making stupid mistakes with macros.
assert.h
It is typical for functions of a library to go through some rigorous testing stages to prove that it produces correct results. While there are many more complete third party solutions, the C standard library provides us with assert.h, which gives us access to a single macro known as assert. While very basic, we can use the assert macro to test the inputs and result of our functions. This is yet another form of debugging to assist us in writing correct programs in C.
Consider a very simple C program assert.c.
// assert.c
#include <stdio.h>
#include <stdlib.h>

int bad_len(const char *str);

int main(int argc, char *argv[]) {
	char *str = NULL;
	int length = bad_len(str);
	printf("strlen: %d\n", length);
	return EXIT_SUCCESS;
}

int bad_len(const char *str) {
	int len = 0;
	if(str != NULL) {
		/* Some fancy code for computing the length */
		len = 4;
	}
	return len;
}
$ gcc -Wall -Werror assert.c
$ ./a.out
strlen: 0
The program didn't fail to compile or run but what exactly went wrong? Why is the length zero? We could just step through the debugger, or make some print statements, but instead let's use assert. Let's modify the following snippet of code by adding in an assert statement.
// assert.c
#include <stdio.h>
#include <stdlib.h>
#include <assert.h>

int bad_len(const char *str);

int main(int argc, char *argv[]) {
	char *str = NULL;
	int length = bad_len(str);
	printf("strlen: %d\n", length);
	return EXIT_SUCCESS;
}

int bad_len(const char *str) {
	int len = 0;
	assert(str != NULL);    /* ADD THIS LINE */
	if(str != NULL) {
		/* Some fancy code for computing the length */
		len = 4;
	}
	return len;
}
Compile this program and run it again.
$ gcc -Wall -Werror assert.c
$ ./a.out
a.out: assert.c:16: bad_len: Assertion `str != ((void *)0)' failed.
Aborted (core dumped)
$
We can see that str was equal to NULL (for some reason I thought it was not) which is why our length returned was 0. Let's fix our program so it passes the assert statement.
// assert.c
#include <stdio.h>
#include <stdlib.h>
#include <assert.h>

int bad_len(const char *str);

int main(int argc, char *argv[]) {
	char *str = "Debugging in C is so awesome.";
	int length = bad_len(str);
	printf("strlen: %d\n", length);
	return EXIT_SUCCESS;
}

int bad_len(const char *str) {
	int len = 0;
	assert(str != NULL);
	if(str != NULL) {
		/* Some fancy code for computing the length */
		len = 4;
	}
	return len;
}
Compile this program and run it again.
$ gcc -Wall -Werror assert.c
$ ./a.out
strlen: 4
$
Hmm. We got rid of the first error, but this is not the right return value. In a more complicated program we might not notice that the return value is incorrect if we didn't print it out. Let's add an assert statement to check the return value of bad_len.
// assert.c
#include <stdio.h>
#include <stdlib.h>
#include <assert.h>

int bad_len(const char *str);

int main(int argc, char *argv[]) {
	char *str = "Debugging in C is so awesome.";
	int length = bad_len(str);
	assert(length == 29);
	printf("strlen: %d\n", length);
	return EXIT_SUCCESS;
}

int bad_len(const char *str) {
	int len = 0;
	assert(str != NULL);
	if(str != NULL) {
		/* Some fancy code for computing the length */
		len = 4;
	}
	return len;
}
Compile this program and run it again.
$ gcc -Wall -Werror assert.c
$ ./a.out
a.out: assert.c:10: main: Assertion `length == 29' failed.
Aborted (core dumped)
Here we can now see very quickly that the length returned by our function was not the correct value. After fixing bad_len, compiling and running again we can get the correct value. We know now that for this input our function is working correctly.
Best practices with assert
While assert is helpful, this is not a good solution for actually error checking inputs in our programs. The assert functionality can be turned off during the compilation process using the flag -DNDEBUG (similar to how you could turn your debug prints using the preprocessor). While grading your assignments, we may compile with -DNDEBUG. Because of this, it is not a good idea to use assert as the only way to validate the inputs to your functions. You should use assert under the following conditions:
- Use assert to check for conditions that should be impossible to happen in your program.
- Use assert during the debugging process to check inputs, but also check them correctly as well.
- i.e., In the example we use assert to fail quickly if the input is NULL, but we still explicitly check to see if the input is
NULLin our normal logic.
- i.e., In the example we use assert to fail quickly if the input is NULL, but we still explicitly check to see if the input is
- Do not use assert when the operation used inside of it has side effects. See the two examples below:
Bad Side Effects Example:
assert(++x > MIN_VALUE);
if(x > MIN_VALUE) {
	/* Do something */
}
Good Side Effects Example:
++x;
assert(x > MIN_VALUE);
if(x > MIN_VALUE) {
	/* Do something */
}
:nerd: Using assert is not required, but it can assist you in tracking down nasty bugs in your program. Usually bugs that happen after changing a seemingly working function or when your function hits an edge case you might have never thought of.
Valgrind
Valgrind is another tool which you can use for detecting errors at runtime. What differentiates Valgrind from gdb is that it can detect things such as memory leaks, out of bounds memory access, use of unintialized variables, open file handles, etc. These type of errors are not directly reported in gdb and errors such as "out of bounds memory access" may just create what is known as a segmentation fault and crash your program without you ever knowing what happens. It's also not an interactive process like gdb (although it is possible to use gdb and Valgrind together at the same time).
Valgrind takes advantage of the debugging symbols added to your program when compiled with the -g flag. You should continue to compile your program with the -g when you use Valgrind to test your program.
Detecting memory leaks
Valgrind is typically used for detecting memory leaks in a program. Let's create a naive program valgrind.c with an obvious memory leak and run it through Valgrind and see what happens.
// valgrind.c
#include <stdlib.h>
#include <stdio.h>

int main(int argc, char *argv[]) {
	int *var = malloc(sizeof(int));
	// Assign a value
	*var = 4;
	// Print the value
	printf("The value of var is: %d\n", *var);
	return EXIT_SUCCESS;
}
$ gcc -Wall -Werror -g valgrind.c
$
The program compiles with no errors but clearly there is a memory leak in this program (We ask for memory using malloc but never free it). To run this program through Valgrind type the following command:
$ valgrind ./a.out
==30532== Memcheck, a memory error detector
==30532== Copyright (C) 2002-2013, and GNU GPL'd, by Julian Seward et al.
==30532== Using Valgrind-3.10.0 and LibVEX; rerun with -h for copyright info
==30532== Command: ./a.out
==30532==
The value of var is: 4
==30532==
==30532== HEAP SUMMARY:
==30532==     in use at exit: 4 bytes in 1 blocks
==30532==   total heap usage: 1 allocs, 0 frees, 4 bytes allocated
==30532==
==30532== LEAK SUMMARY:
==30532==    definitely lost: 4 bytes in 1 blocks
==30532==    indirectly lost: 0 bytes in 0 blocks
==30532==      possibly lost: 0 bytes in 0 blocks
==30532==    still reachable: 0 bytes in 0 blocks
==30532==         suppressed: 0 bytes in 0 blocks
==30532== Rerun with --leak-check=full to see details of leaked memory
==30532==
==30532== For counts of detected and suppressed errors, rerun with: -v
==30532== ERROR SUMMARY: 0 errors from 0 contexts (suppressed: 0 from 0)
$
Here, you can see in the green text that this program had 1 memory allocation, but no frees. Then, in LEAK SUMMARY you can see in the red text that the program definitely lost 4 bytes. So these lines tell us there was a memory leak but from what?
If you look at the Valgrind printout, it provides us with instructions, which we highlighted in purple, to use the flag (--leak-check=full) to get more details about the errors detected by Valgrind.
$ valgrind --leak-check=full ./a.out
==30535== Memcheck, a memory error detector
==30535== Copyright (C) 2002-2013, and GNU GPL'd, by Julian Seward et al.
==30535== Using Valgrind-3.10.0 and LibVEX; rerun with -h for copyright info
==30535== Command: ./a.out
==30535==
The value of var is: 4
==30535==
==30535== HEAP SUMMARY:
==30535==     in use at exit: 4 bytes in 1 blocks
==30535==   total heap usage: 1 allocs, 0 frees, 4 bytes allocated
==30535==
==30535== 4 bytes in 1 blocks are definitely lost in loss record 1 of 1
==30535==    at 0x4C2ABA0: malloc (in /usr/lib/valgrind/vgpreload_memcheck-amd64-linux.so)
==30535==    by 0x40059E: main (valgrind.c:5)
==30535==
==30535== LEAK SUMMARY:
==30535==    definitely lost: 4 bytes in 1 blocks
==30535==    indirectly lost: 0 bytes in 0 blocks
==30535==      possibly lost: 0 bytes in 0 blocks
==30535==    still reachable: 0 bytes in 0 blocks
==30535==         suppressed: 0 bytes in 0 blocks
==30535==
==30535== For counts of detected and suppressed errors, rerun with: -v
==30535== ERROR SUMMARY: 1 errors from 1 contexts (suppressed: 0 from 0)
$
The flag --leak-check=full gives us the extra content in red which tells us that this memory leak originates from line 5 which is where we originally used malloc to allocate the integer.
Out of bounds access
Let's fix the memory leak by adding a free call and instead access a value out of bounds.
// valgrind.c
#include <stdlib.h>
#include <stdio.h>

int main(int argc, char *argv[]) {
        int *var = malloc(sizeof(int));
        // Assign a value
        *var = 4;
        // Print the value
        printf("The value of var is: %d\n", *var);
        printf("Out of bounds access: %s\n", argv[-1]);
        free(var);
        return EXIT_SUCCESS;
}
$ gcc -Wall -Werror -g valgrind.c
$
Still no errors produced. Now let's run the program through Valgrind again.
$ valgrind --leak-check=full ./a.out
==30552== Memcheck, a memory error detector
==30552== Copyright (C) 2002-2013, and GNU GPL'd, by Julian Seward et al.
==30552== Using Valgrind-3.10.0 and LibVEX; rerun with -h for copyright info
==30552== Command: ./a.out
==30552==
The value of var is: 4

==30552== Invalid read of size 1
==30552==    at 0x4E82AF3: vfprintf (vfprintf.c:1642)
==30552==    by 0x4E8B588: printf (printf.c:33)
==30552==    by 0x400620: main (valgrind.c:10)
==30552==  Address 0x1 is not stack'd, malloc'd or (recently) free'd
==30552==
==30552==
==30552== Process terminating with default action of signal 11 (SIGSEGV)
==30552==  Access not within mapped region at address 0x1
==30552==    at 0x4E82AF3: vfprintf (vfprintf.c:1642)
==30552==    by 0x4E8B588: printf (printf.c:33)
==30552==    by 0x400620: main (valgrind.c:10)
==30552==  If you believe this happened as a result of a stack
==30552==  overflow in your program's main thread (unlikely but
==30552==  possible), you can try to increase the size of the
==30552==  main thread stack using the --main-stacksize= flag.
==30552==  The main thread stack size used in this run was 8388608.
Out of bounds access: ==30552==
==30552== HEAP SUMMARY:
==30552==     in use at exit: 4 bytes in 1 blocks
==30552==   total heap usage: 1 allocs, 0 frees, 4 bytes allocated
==30552==
==30552== LEAK SUMMARY:
==30552==    definitely lost: 0 bytes in 0 blocks
==30552==    indirectly lost: 0 bytes in 0 blocks
==30552==      possibly lost: 0 bytes in 0 blocks
==30552==    still reachable: 4 bytes in 1 blocks
==30552==         suppressed: 0 bytes in 0 blocks
==30552== Reachable blocks (those to which a pointer was found) are not shown.
==30552== To see them, rerun with: --leak-check=full --show-leak-kinds=all
==30552==
==30552== For counts of detected and suppressed errors, rerun with: -v
==30552== ERROR SUMMARY: 1 errors from 1 contexts (suppressed: 0 from 0)
Segmentation fault (core dumped)
$
Accessing the array out of bounds in this case created a segmentation fault (this is lucky; sometimes these things don't crash and gives you bugs which you can't reproduce) and crashed the program before free could be called (hence the still reachable 4 bytes). The text colored in red shows Valgrind reporting that an out of bounds memory access has occurred.
This is a short intro to Valgrind but should be all you need for creating correct programs with no memory leaks in C.
Linters
There exists a tool called a linter which you may find very helpful. Similar to syntax errors, if you have a linter installed in your editor as you type code, you will see errors. These errors will not be syntax errors. Instead, they alert you about memory leaks, and unused variables, etc. The following is a list some popular linters for a few popular text editors.
- Sublime text
- sublimelinter - Required to be installed
- Pick one of the following
- sublimelinter-clang (This one seems to be better)
- sublimelinter-cpp
- Atom
- linter-clang (This one seems to be better)
- linter-gcc
- Vim
A linter may exist for your favorite editor, but you will have to find it for yourself.
Conclusion
Now that you have read about the many different techniques to debug your program, you should now apply these things to all homework assignments for the rest of the semester. Now move on to the HW2 Assignment. You will want to refer back to this document for reference as many of the errors and issues you will encounter are described in this document.